Manage containers
When an application encounters issues such as CrashLoopBack, slow startup, or sudden resource spikes, container-level inspection is often the most direct way to troubleshoot. The pod detail page in Control Hub aggregates information of all containers within a specific pod, providing events, visual charts, and logs to help you quickly identify and resolve problems.
View Pod details
To view the containers in a Pod:
In the left navigation bar, click Browse, and select the target namespace from the first column.
In the second column, expand Deployment, StatefulSet, or DaemonSet, then select the desired workload and drill down to its Pods list.
Click on the target pod.
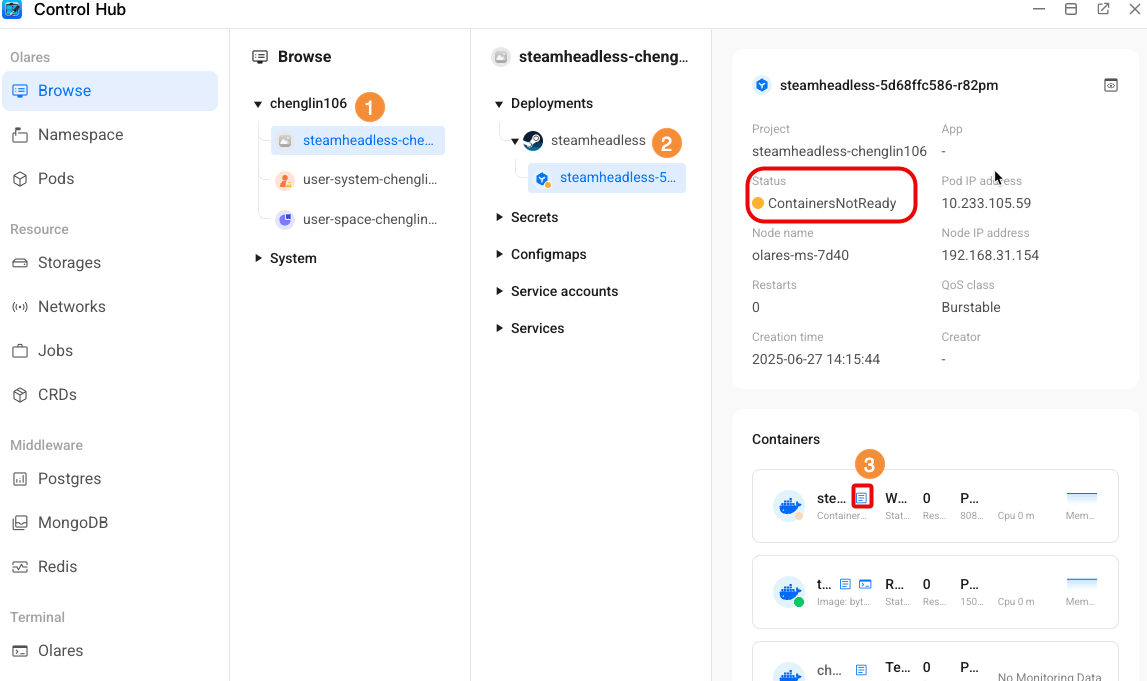
In the third column, view the detailed pod information:

Section Content Info Basic data such as pod status, restart count,
IP, node, QoS, and imagesContainers Real-time CPU/memory usage charts, image versions, status
with options to export logs and access the container shellVolumes Mounted persistent volumes, paths, and access modes Environment Variables All injected variables with expand-to-view support Events Recent one-hour event logs for scheduling, probes, networking, etc. TIP
You cannot directly edit pod YAML from this view. YAML configurations are managed by Olares via workload templates and webhooks.
View container status
For each container listed within a pod, you can:
- Click the entry to view detailed container information, including status, image info, image pull policy, ports, and container metadata.
- View container ports and environment variables.
- Access the container’s command-line shell.
- View or export container logs in real time.

Export container logs for troubleshooting
Exporting container logs, along with Events and resource charts, helps quickly identify issues such as CrashLoopBack, probe failures, or OOM (Out of Memory) errors.
- In the left navigation bar, click Browse, and select the namespace for the problem application.
- In the second column, click to expand Deployments > Target deployment > Pods.
- In the Pods detail page, locate the abnormal container (typically marked with an orange status indicator), and click the article button.
- In the pop-up log window, you can:
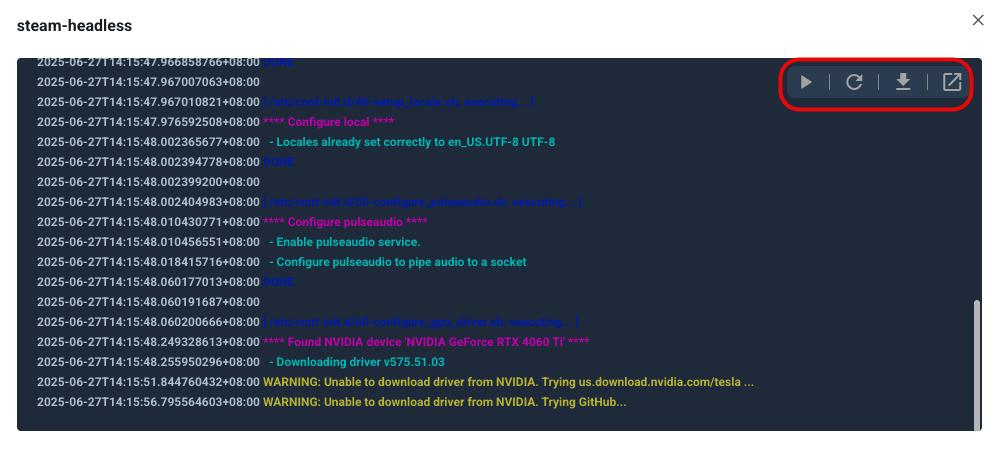
- Click download_2 to download the complete log file.
- Click autorenew to refresh and view the latest log entries.
- Click play_pause to start or pause real-time log updates.